Catch an Idea. Pass it On. Build the Network.

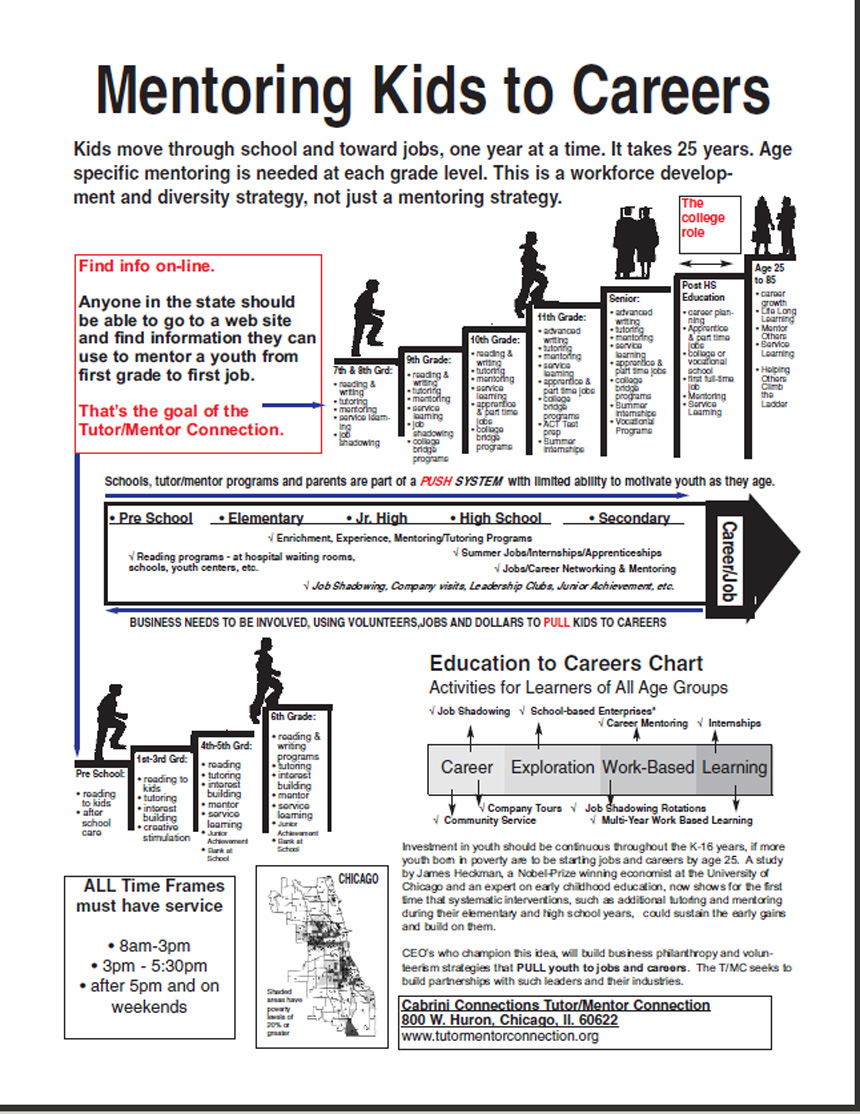
My friend Terry Elliott, a professor at Western Kentucky University, saw one of my Twitter posts, in which I shared a link to the concept map at the left. 

If you’ve followed my blog, you’ll recall that Terry and I met through a Making Learning Connected cMOOC, and exchanged some visualization ideas last July in this article.

DownUp (No Ratings Yet)
Loading...

Visualizing New Ways to Solve Social Problems

The graphic below is from this animation, created by interns from IIT in Chicago during 2008-09 internships. The goal was to share the vision and four-part strategy piloted by the Tutor/Mentor Connection (T/MC) since it was launched in 1993.

Since 2005 a number of interns have worked with T/MC.…

DownUp (No Ratings Yet)
Loading...

A Visual Tilt-a-Whirl, a Carny Ride of Systems Thinking – Ride With Me

Terry Elliot, who I first met during the 2014 Making Learning Connected MOOC, posted this “Visual Tilt-a-Whirl” statement as an introduction to a July 19th Faceblook post. He included the graphic below, and a link to his blog, where he describes the graphic.…

DownUp (No Ratings Yet)
Loading...

Constant Improvement – Inspired By Others

I’ve written about MOOCs in the past, and I’m taking part in the 2015 Making Learning Connected MOOC right now. Participants are encouraged to “make” digital images, trying out new tools. Learning from others is part of the fundamental goal of MOOCs like this.…

DownUp (No Ratings Yet)
Loading...

#CLMOOC Make Cycle #2: Re(Media)te with ME

I started taking part in MOOCs several years ago and am now part of the 2015 Connected Learning MOOC #CLMOOC. We’re in the second week, and each week a newsletter introduces a new theme for learning. The theme this week is Re(Media)te with ME, which means participants are encouraged “to choose something (an artifact, a story, a picture, a video clip, an anything) and over the course of the week remediate it through one or more different media.”…

DownUp (No Ratings Yet)
Loading...

A Collaboration of the Willing – Leading from the Behind

I’ve used this graphic dozens of times to illustrate a vision of engaging workplace volunteers in long-term strategies that help inner-city youth move from first grade to first jobs. I’ve created a library of graphics like this on Pinterest and posted a library of illustrated essays on Scribd.com

DownUp (No Ratings Yet)
Loading...

Bono, the Pope, Pallotta, Poverty & Data

I apologize for another long post. However, I’m trying to tie several streams of thought together. I hope you’ll follow and add your own thinking.

Last Sunday I read an article in the Chicago Tribune titled “Pope wants more focus on poor.”…

DownUp (No Ratings Yet)
Loading...

Infographics to Enable Teaching and Learning

The opinion mill may be churning–some sources suggest infographics are dead, while others say we should move on to more appealing “story-telling agents.” But don’t yet discount their place in the classroom. Regardless of their web trend status, infographics’ ability to visually present complex data has stood the test of time.…

DownUp (No Ratings Yet)
Loading...

Digital Literacy Redux

I can see now that my initial attempt at a definition of digital literacy was too narrow and that my academic librarian bias is all too evident in the narrow focus on “information”.  To remind myself to look beyond just one aspect of digital literacy I created this peacock to try to pull together and visualize Doug Belshaw’s elements of digital literacies combined with some of the concepts discussed in Howard Rheingold’s webinar on Literacies of Attention.…

DownUp (No Ratings Yet)
Loading...

What do I do? What is a MOOC?

I’ve written many articles in the past about learning and network building and since mid January I’ve been part of an Education Technology and Media MOOC #ETMOOC where more than 1600 people are gathering on-line to share ideas about learning, digital story telling, on-line collaboration, etc.…

DownUp (No Ratings Yet)
Loading...